
Official estimates indicate that meat consumption is falling in the UK – not all of the data agrees

Responsible for roughly a third of the U.K.’s diet-related carbon emissions, the consumption and production of meat is a substantial contributor to climate change. A report commissioned by the government last year reflects this, finding that people must eat 30% less meat by the end of the decade to reduce the environmental impact of food production.
Research indicates that meat consumption habits have changed. One study reports that the amount of meat eaten each day per person fell by 17% on average in the U.K. between 2008 and 2019.
This result has been widely accepted and was obtained by analyzing the meat consumption data published in the National Diet and Nutrition Survey. By asking participants to record how much of a certain food they have eaten over a given time period, the survey captures nationally representative data on the food people are eating in the U.K.
Our research compared this trend to other datasets and instead suggests that the reduction in meat consumption could be far smaller. Britons may still be consuming too much meat, with profound environmental consequences.
Recording meat consumption
Trends in food consumption are estimated using three types of dataset: dietary recall surveys (which include the National Diet and Nutrition Survey), household budget surveys and food balance sheets. Each dataset is constructed using a different type of information and the accuracy of each is unclear.
Household budget surveys ask participants to record how much of a particular food item they have purchased. Fewer meat purchases tend to mean less household meat consumption. Household budget surveys show just a 3% decline in meat purchases in the U.K. from 2008 to 2019.
Food balance sheets instead measure how much food is available to buy and are constructed using industry data. In practice, a fall in meat supply suggests that a decreasing amount of meat is being consumed. Meat supply decreased by 5% in the U.K. over the same period.
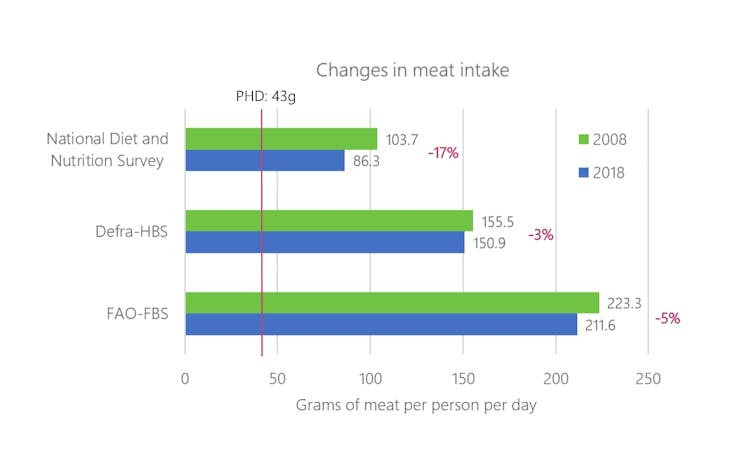
The levels of of meat reduction vary between the three datasets. Author provided
Although neither household budget surveys or food balance sheets directly measure consumption, they are often used to approximate changes in consumption patterns. Compared to the trends captured by the National Diet and Nutrition Survey, they imply a smaller decline in U.K. meat consumption.
This variation means that we cannot be certain about which dataset provides the closest approximation of actual meat consumption. Two factors are responsible for the wide range in consumption estimates.
1. Underreporting
Surveys often depend on inaccurate data. As they rely on individual reporting, both household budget surveys and dietary recall surveys are subject to underreporting. This can occur when respondents accidentally forget to record the food that they have eaten or do not wish to declare it.
Underreporting seems to be increasing over time. This could be the result of many factors, but some studies have found that underreporting is significantly higher in overweight and obese individuals.
Rising obesity rates, increased snacking outside the home, and falling survey response rates have all interfered with the accuracy of dietary data. According to the Office for National Statistics, the National Diet and Nutrition Survey may have underestimated calorie intake by as much as 34% in 2019.
Even if there has been no change to actual consumption, the large fall in meat consumption estimated by the National Diet & Nutrition Survey could be due to under-reporting.
2. Waste
As food balance sheets rely on industry data, they are less subject to underreporting. But the amount of food that is wasted can also interfere with the accuracy of dietary data.
As indirect measures of consumption, food balance sheets and household budget surveys incorporate food wastage. Food on the supermarket shelf can either be bought or wasted, just as food that has been purchased can be consumed or thrown away.
Changes in waste can therefore result in apparent (but not actual) changes in consumption. A reported increase in consumption could actually be masking an increase in food waste.
Change in the quantity of food wasted will affect the difference between true consumption and apparent consumption, measured using household budget surveys or food balance sheets. If meat waste increased and actual meat consumption decreased by the same amount, apparent meat consumption would not change.
This could conceal trends in declining consumption. An increase in the quantity of meat wasted could potentially be responsible for the differences in trends between the three types of dataset.
As a direct measure of consumption, dietary recall surveys do not include waste. Unlike household budget surveys and food balance sheets, their accuracy will not be affected by changes in the quantity of waste.
Each dataset suggests that U.K. meat consumption is declining, but the magnitude of the decline is uncertain.
Yet our research suggests that the decline in U.K. meat consumption could be much less than officially estimated. Further steps must be taken to ensure we meet the targets for a healthy and sustainable food system.
Better data collection on food waste and underreporting is needed. Data on the extent of underreporting in dietary datasets and the proportion of food wasted at each stage of the production chain would be a start, providing consistency in long-term dietary trends. This would allow the use of multiple different dietary datasets to more accurately approximate consumption.
Kerry Smith, PhD candidate in Biological Sciences, University of Reading and Emma Garnett, Researcher in the Health Behaviours Team, University of Oxford
This article is republished from The Conversation under a Creative Commons license.